Machine Learning for Stablecoin Depeg Risk
An eight-year study comparing Logistic Regression, Random Forest, LSTM, SHAP, and three VaR methods across different stablecoin architectures.
What this project proves
AI assists the portfolio summary, copy editing, and visual presentation; research claims remain bounded by the dissertation analysis, temporal validation, and published limitations.
Eight years of public market data, cross-model comparison, SHAP, event studies, three VaR methods, and out-of-time validation.
Evidence trail
Last reviewed2026-08-24See what is live, bounded, and still next.
The dissertation baseline, daily operating service, and Advanced interface are verified separately. The live page remains a diagnostic product rather than presenting historical models as an oracle.
Frozen MSc research baseline
Checksums preserve the submitted baseline; later product work cannot rewrite the eight-year analysis, model comparisons, SHAP, events, or VaR findings.
Daily precompute and numerical verification
GitHub Actions runs the research pipeline, Supabase stores results, and the API reports verification figures while compute stays separate from viewing.
Public Advanced risk monitor
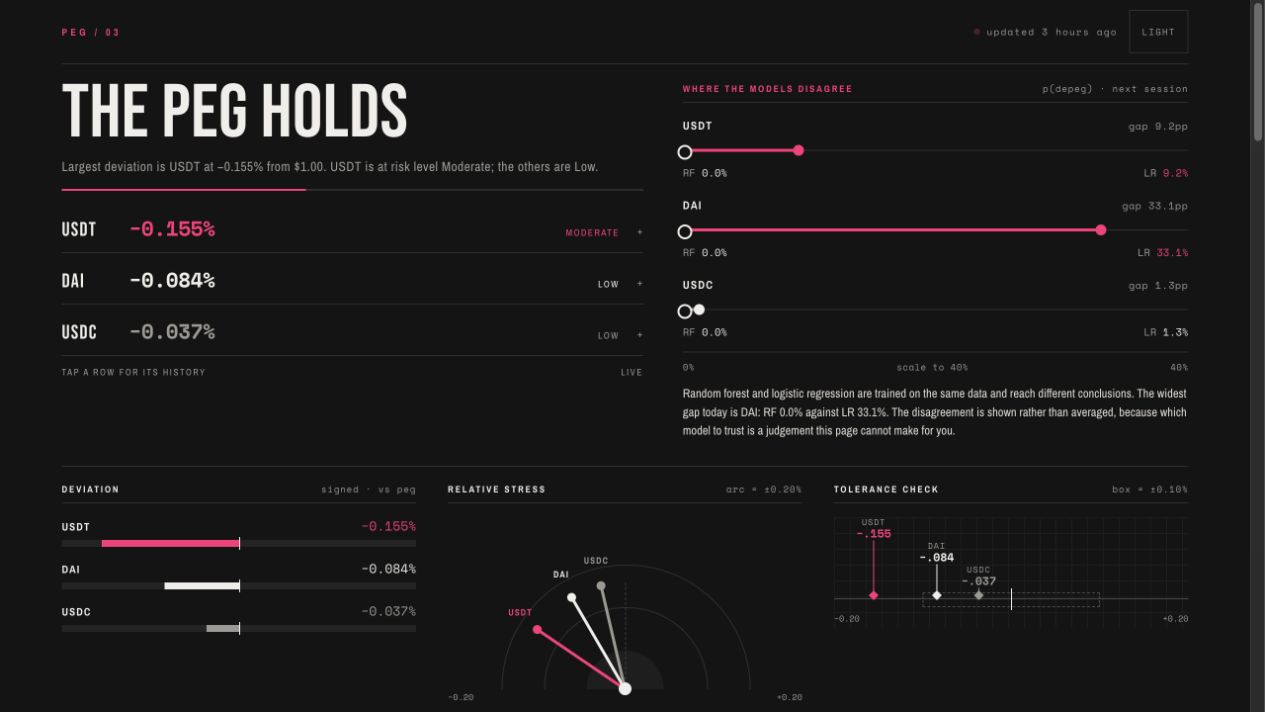
The public page exposes peg conclusions, model disagreement, historical stress, and provenance while retaining its active-development boundary.
Broader assets and licensed data
FDUSD, PYUSD, macro assets, and licensed data remain future scope and are not folded into current completion claims.
8 yearsMarket data, 2018–2025
3Stablecoin architectures
6.1–8.1×Modified vs Parametric VaR
Problem
Stablecoins appear low-volatility, yet conventional Gaussian risk measures can materially understate rare and severe depeg events.
Build
Use 2018–2025 data for USDT, USDC, DAI, and four benchmarks to build classification, time-series, event-study, SHAP, and tail-risk analyses.
Outcome
Model suitability proved architecture-dependent; Modified VaR exceeded Parametric VaR by 6.1–8.1×, while temporal validation exposed regime shifts after major events.
Three tests, one uncomfortable conclusion
Move through stablecoins and evidence layers to test model fit, fat-tail risk, and temporal robustness. Every figure comes from the frozen dissertation analysis, not a live market forecast.
Does one model win everywhere?
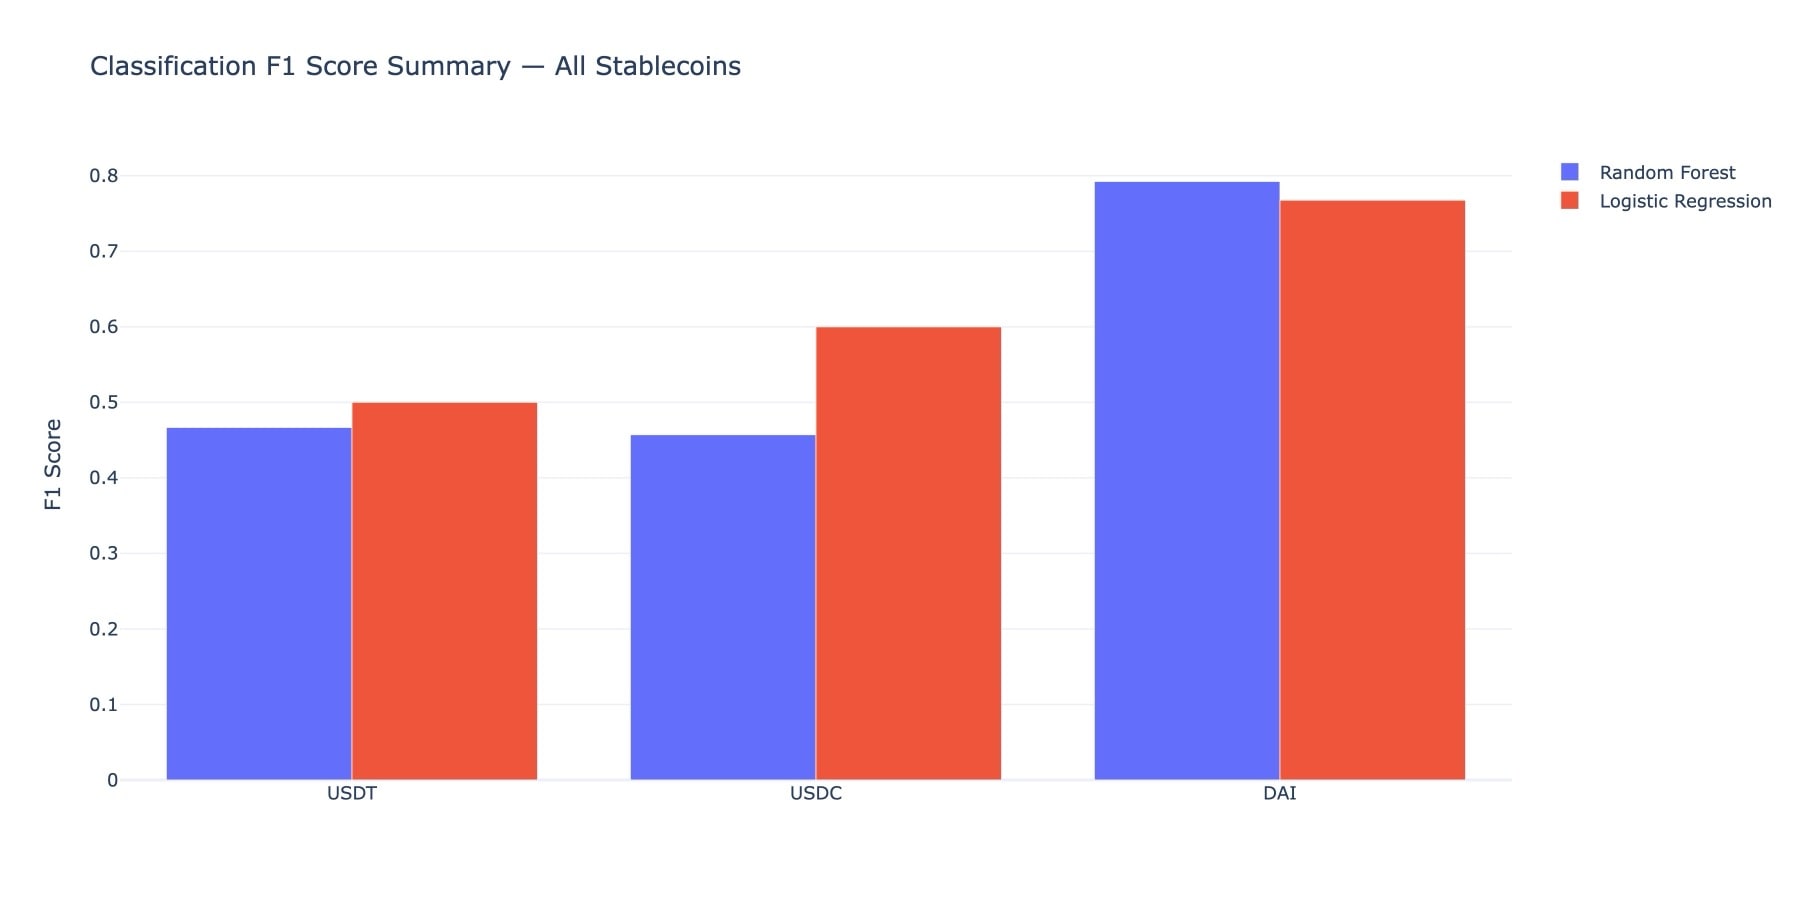
Classification F1 score · dissertation sample
Collateral architectureFiat-backed
The linear model led narrowly; the small gap does not justify treating complexity as an advantage.
Collateral architectureFiat-backed
Logistic Regression led on the full sample, but chronological validation later overturns an overconfident reading.
Collateral architectureCrypto-collateralised
Random Forest led narrowly for the nonlinear crypto-collateralised structure; fit depends on the risk mechanism.
What does a normal distribution miss?
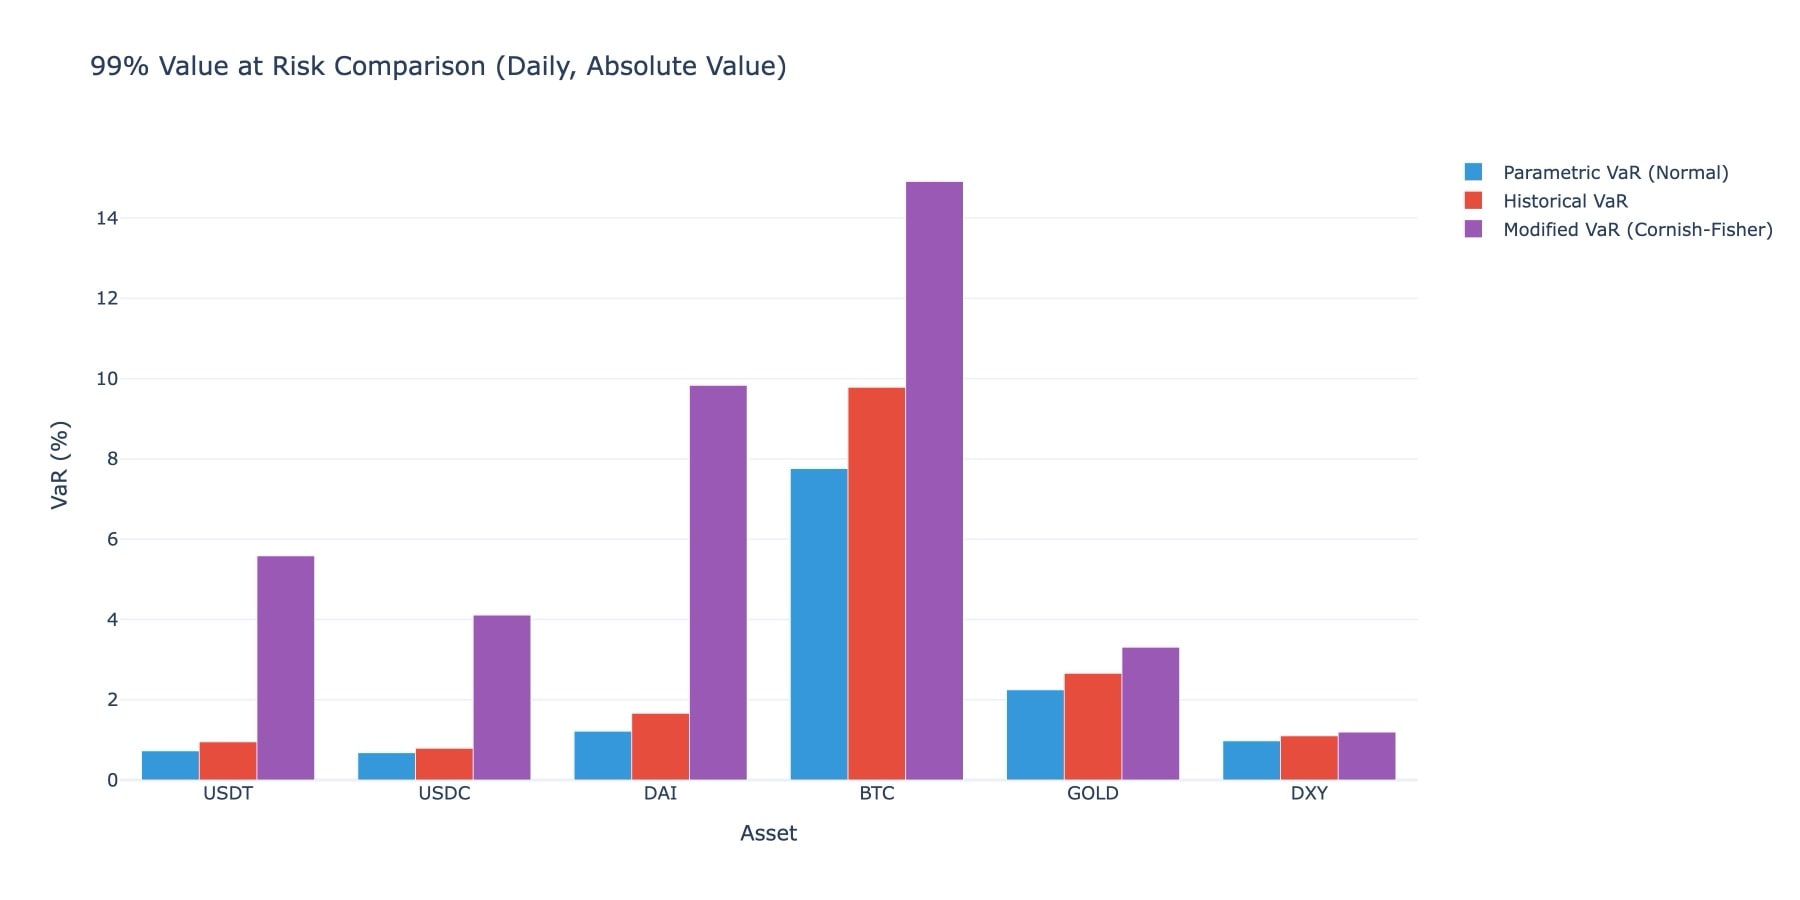
99% daily VaR · absolute value
Modified / Parametric8.1×
Skewness and fat tails move the estimate far beyond the Gaussian baseline.
Modified / Parametric6.1×
Skewness and fat tails move the estimate far beyond the Gaussian baseline.
Modified / Parametric8.1×
Skewness and fat tails move the estimate far beyond the Gaussian baseline.
Does the result survive time?
USDC · Random Forest · F1
Random split0.83Looks strong
Chronological split0.09Regime shift exposed
A strong random split collapsed after chronological separation. Major events can change the risk-generating process, making the model more useful for diagnosis than timeless prediction.
Research conclusionDiagnostic, not an oracle.
Architecture changes model fit
Compare the same two classifiers across fiat-backed and crypto-collateralised designs.
Quiet prices can hide violent tails
Switch from a Gaussian baseline to empirical and skew-adjusted risk estimates.
Time is the harder test
Chronological separation reveals whether a result survives a changing market regime.
Evidence boundary: Published figures are historical dissertation results; they are not investment advice, a live alert, or a guarantee of future performance.
Version evolution
In active developmentThree product generations, not a reskin
The same research began as an operable Streamlit workbench, became a deployable Plain Monitor, and was then re-edited as an Advanced risk report with a deliberate reading order. All three remain visible so the productisation can be inspected.
Master Final / 2026-04 · frozen
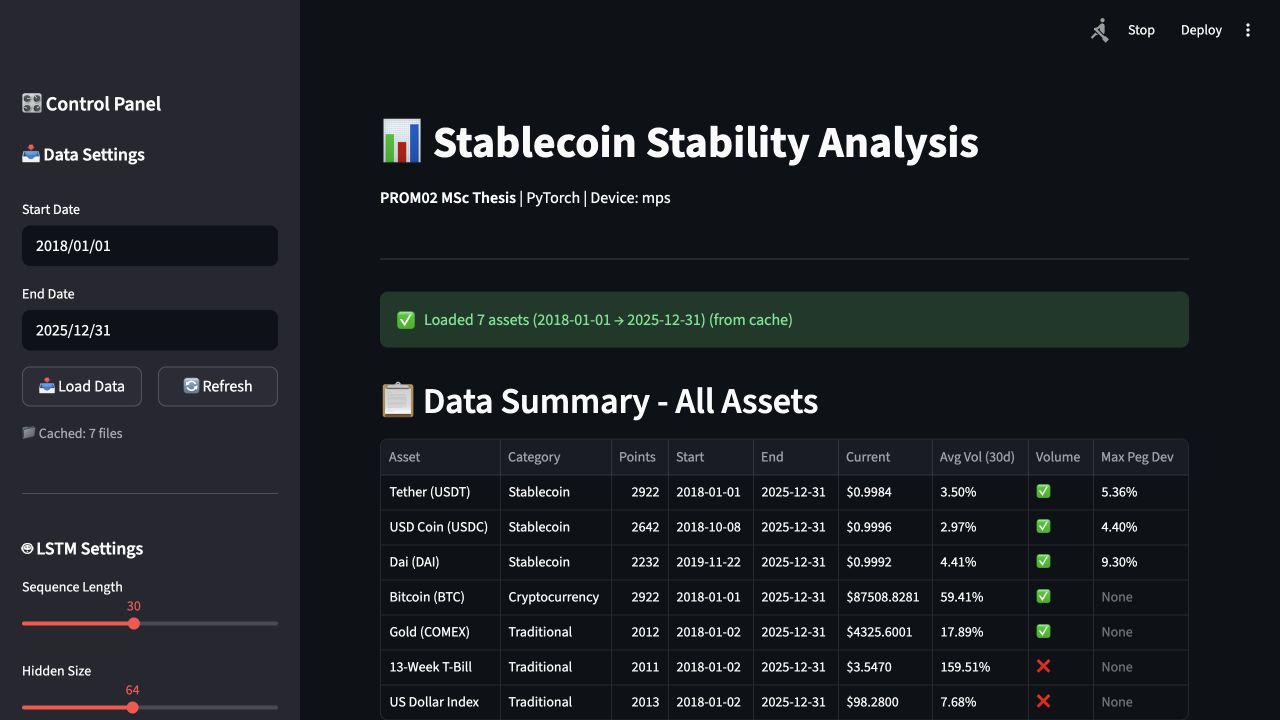
Research workbench
Deep and complete, but researcher-operated
A 3,224-line Streamlit script combined data loading, model training, controls, charts, and exports. It served exploration and viva defence, not a public daily ritual.
- 10 interactive analysis tabs
- LSTM, classification, SHAP, VaR, and events
- Checksum-frozen after submission
Plain Mode / 2026-08-22
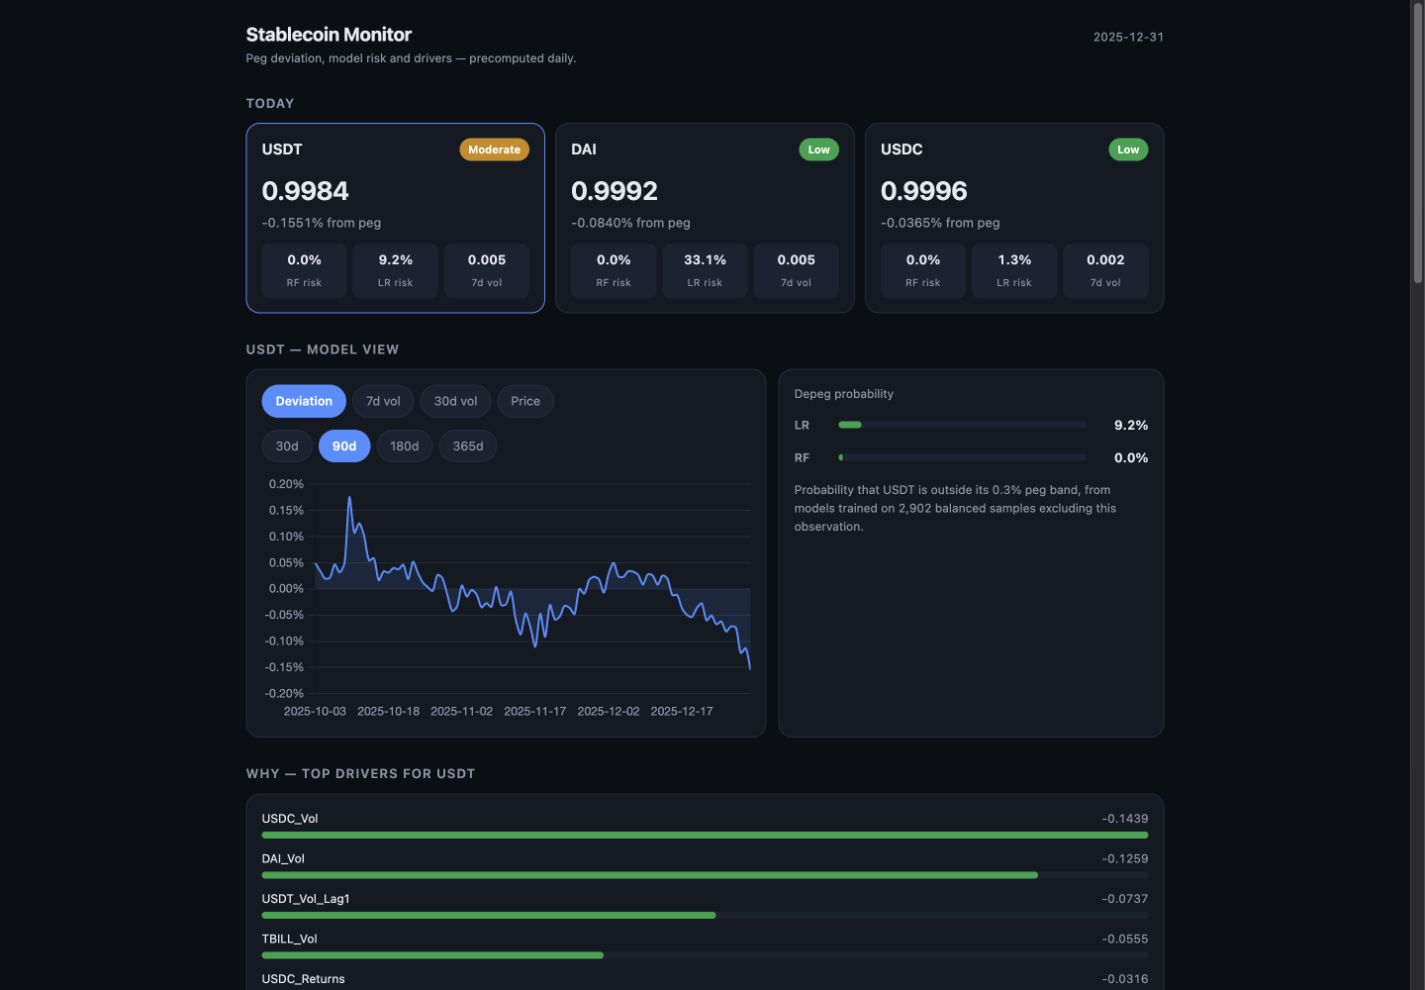
Operational monitor
Reliability before presentation
Compute and view were separated for the first time: GitHub Actions precomputed, Supabase stored, and FastAPI with Vercel only served results. The engineering behaved like a product; the interface still looked generic.
- Daily 06:15 UTC run
- 11 core modules
- 250 parity checks carried the port
Advanced / 2026-08-23 · active
Risk intelligence report
From displaying data to guiding judgement
Five evidence tiers organise current state, model disagreement, analytical basis, historical stress, and provenance. It is public and usable while numerical semantics and mobile behaviour continue to be reviewed.
- Daily Peg Report with figure verification
- Model disagreement remains visible
- 289 parity checks reported by the API
這是我的資料科學碩士論文項目。研究重點不是把機器學習包裝成預言工具,而是測試它能否更有效地揭示穩定幣背後隱藏的風險結構。
This is my MSc Data Science dissertation project. The goal was not to present machine learning as a crystal ball, but to test whether it can expose hidden structures in stablecoin fragility more effectively than conventional linear measures.
Research design
- Daily OHLCV data from January 2018 to December 2025
- Three stablecoins: USDT, USDC, and DAI
- Four benchmarks: Bitcoin, Gold, the US Dollar Index, and 13-week US Treasury Bill yield
- Logistic Regression and Random Forest classification
- LSTM price-path forecasting
- SHAP model interpretation
- Event studies covering Terra/Luna, FTX, and the USDC/SVB episode
- Parametric, Historical, and Modified Value-at-Risk at 99% confidence
What the models revealed
Model choice was architecture-dependent. Logistic Regression performed better for the fiat-backed stablecoins, while Random Forest performed best for crypto-collateralised DAI. Peer-stablecoin volatility and cross-market stress signals were among the most informative depeg indicators.
The largest lesson came from the tails. Modified VaR estimates were 6.1 to 8.1 times their Parametric equivalents, showing how strongly a Gaussian assumption can understate stablecoin fragility.
Honest limitation
Temporal validation showed that performance can collapse when the underlying risk-generating process changes. In one untuned robustness test, USDC Random Forest F1 fell from 0.83 to 0.09 after chronological separation. That result changed how I interpret the project: the models are most valuable as diagnostic systems, not as timeless forecasting engines.
Stack
Python, pandas, scikit-learn, TensorFlow/Keras, SHAP, yfinance, statistical event analysis, and reproducible chart generation.